Financial Statement Analysis - Price/Earnings Ratios
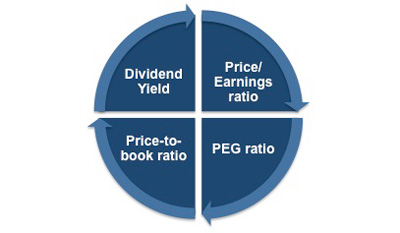
The accounting ratios that focus on the investment potential an organization offers include:
• Price/earnings ratio
• Price-to-book ratio (P/B)
• PEG (price/earnings to growth) ratio
• Dividend yield
These ratios are most useful when the data behind them is from regularly produced management accounts.
They are concerned with the return on investment for shareholders, and with the relationship between return and the value of an investment in a company's shares.
 |
These figures are a constant focus of senior management's attention, which is a good reason for understanding how they are derived and what they mean.
This Key Financial Ratios Checklist details the key financial ratios you can use to help you interpret financial information. This Financial Ratio Formulas Checklist provides you with a list of the most popular financial ratios used to assess an organization's performance, solvency, profitability and investment potential.
Price/Earnings (P/E) Ratio
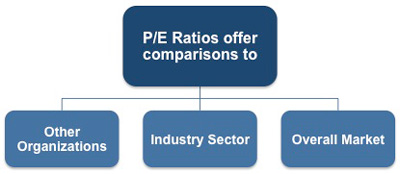
This is one of the most helpful of the investment ratios and is often abbreviated to P/E ratio. It can be used to compare an organization to:
1) Other organizations
2) Industry sector
3) Overall market e.g. S&P 500, FTSE 100, etc.
This ability to make such comparisons is one of the reasons it is widely used by management. It also offers the flexibility to use either quarterly or annual data. Many management teams use sites such as Reuters' comparison tables to help with this activity.
 |
In commercial organizations a significant proportion of management personnel receive stock or options on stock as part of their benefits package and this drives their personal interest in the P/E ratio. The belief is that by aligning the interests of management with the interests of other stock holders the former are more committed to the organization.
A P/E ratio can be thought of as how long a stock will take to pay back the investment if there is no change in the business. Whilst stock can go up in value without significant earnings increases, it is the P/E ratio that decides if it can stay up. Without earnings to back up the price, a stock will eventually fall back in value.
The P/E ratio can be calculated by dividing the current share (stock) price by the earnings per share (often referred to as EPS) for the previous 12 months.
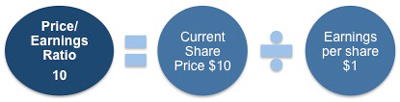 |
For example:
An organization's stock is trading at $10 per share and its earnings per share = $1.
Its P/E Ratio = 10 ÷ 1 = 10
This figure of '10' is sometimes seen as meaning that you will make your money back in ten years' time if nothing changes.
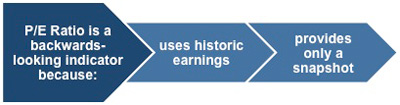
There are key issues that must be acknowledged when using a P/E ratio and they are that this ratio:
1) Uses historic earnings. This is because of the nature of how EPS is calculated using the previous 12-month earnings. (In most cases, the four most recent reported quarterly net earnings per share are totaled.)
2) Only provides a snapshot based on the current share price. The very nature of stocks means that their value is constantly fluctuating. (P/E ratio rises with share price and vice versa.)
It is possible to calculate a forward P/E ratio using the projected earnings for the coming year, but this can be inaccurate because actual earnings may be significantly different to the estimates.
 |
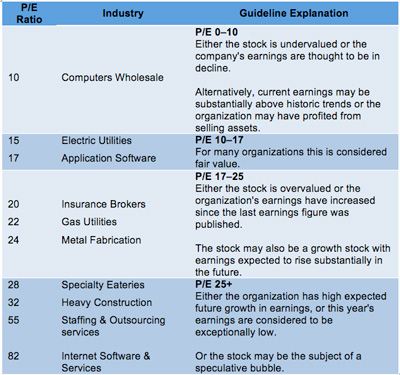
The following table shows the P/E ratios for ten different industry sectors and shows the wide variation that exists. To add further clarity, the far right column contains a rough explanation of how the recognized ratio bands are interpreted.
 |
In the case where an organization has no earnings, or is making a loss (negative earnings), they are treated as having an undefined P/E ratio, shown as 'N/A' (not applicable), even though a negative P/E ratio can be mathematically determined.
The P/E ratio can be interpreted in various ways, but it is not an exact science. In common with most financial ratios, it should not be used in isolation. There are several different factors that can affect this ratio and some of the most common are:
• P/E ratio is highly dependent on how much debt the organization has.
• Stock prices rise in one of two ways:
• Improved earnings
• An improved multiple that the market assigns to those earnings.
• Managers have strong incentives to boost earnings per share, which can influence the organization's decisions. For example:
Low P/E ratio organizations:
May look to make an acquisition, seeking organizations that have a higher P/E ratio than its own, as they often prefer to pay in cash or debt rather than in stock.
May seek to acquire small, high-growth businesses they can 'rebrand' and use to burnish their image as growth stocks to raise their rating.
Higher P/E ratio organizations:
With volatile earnings may desire to create a conglomerate to find ways to smooth earnings and diversify risk.
May look to acquire other organizations with lower P/E ratios, using their stock as a means of payment.
Where there is a risk of bankruptcy forcing up the cost of debts (higher leverage), or where profits decline substantially (reducing the P/E ratio), the indebted firm will have a higher P/E ratio than a firm with less leverage.
If you need a basic financial accounting principles pdf then download our free eBook now.
You may also be interested in:
Financial Statement Analysis | Key Accounting Ratios | Types of Key Accounting Ratios | Current Ratio Analysis | Calculating Profit | Business Performance Ratios | Price-to-Book Ratio | PEG (Price/Earnings to Growth) Ratio | Dividend Yield.
|
|
 |