Financial Statement Analysis - Business Performance Ratios
There are several key accounting ratios that you can use to measure how an organization is performing in terms of both profitability and efficiency. This Key Financial Ratios Checklist details the key financial ratios you can use to help you interpret financial information. This Financial Ratio Formulas Checklist provides you with a list of the most popular financial ratios used to assess an organization's performance, solvency, profitability and investment potential.
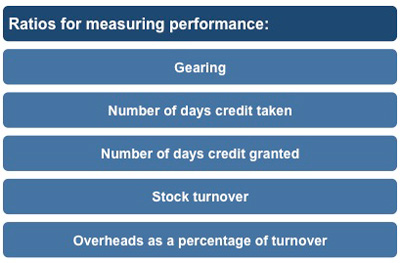 |
The ratios for measuring performance are:
• Gearing
• Number of days credit granted
• Number of days credits taken
• Stock turnover
• Overheads as a percentage of turnover
Gearing
This ratio looks at total borrowings divided by net worth of the business. Ideally, equity should be significantly higher than debt.
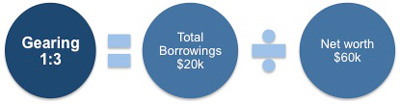 |
If an organization's net worth (as shown in the balance sheet) was $60,000 and the borrowings came to $20,000 (made up of a bank loan and overdraft), then the borrowing ratio would be 1:3. In this example the equity is higher than its debt, but to understand the implications of this you would need to look at the expected gearing figure within the industry.
The purpose of this ratio is to compare the finance provided by lenders with the finance invested by shareholders. Generally speaking, banks do not like to see the amount of debt exceed the amount of equity. The ratio is usually expressed as a proportion (as in 1 to 1), although it can sometimes appear as a percentage. Gearing is said to be high when borrowing is high in relation to equity.
Number of Days Credit Granted
This ratio is used to measure the effectiveness of an organization's debt collection. It sets out the relationship between debtors and the sales that have been made on credit, and also shows how quickly customers are paying their invoices.
 |
The calculation for this ratio is trade debtors (this figure is taken from the balance sheet) divided by annual sales and then multiplied by 365 days. This ratio gives a rather broad-brush calculation.
If you wanted to use a more detailed calculation you would look at how many days' turnover it took to make up the debtor total.
For example: An organization's
Current debtors = $50,000
Sales in current month = $30,000
Sales in previous month = $40,000
The current debtors ($50,000) therefore represent all of the current month's sales ($30,000) and half of the previous month's sales ($20,000).
Therefore the number of debtor days in this example is calculated by adding debtor days from the current month (31 days) and the previous month (30 days).
Current month has 31 days
Balance from previous month: $20k ÷ $40k x 30 days = 15 days
Total debtor days = 31 days + 15 days = 46 days
If this figure began to increase you would need to look carefully at the debt collection routines of the organization. The sort of queries you would want answered are:
1) Are customers taking longer to pay?
2) Are a few customers building up a large debt?
Either of these factors may give cause for concern because the older a debt becomes, the more likely it is to go bad.
The figure for trade debtors normally comes from the closing balance sheet and care should be taken that it is typical for the whole year. If sales taxes are included in this, they must be included in both the turnover figure and the trade debtors figure.
Number of Days Credit Taken
This ratio sets out the number of days the organization takes to pay its suppliers. This is arguably less important than the 'debtor day' figure, as in this case the control over payment of suppliers is in the organization's own hands.
When assessing another organization - for example one that is asking you for increased credit - this ratio can give a useful pointer as to whether the organization is operating within the accepted norms of the industry and (using historic data) whether or not it is taking increasingly longer to pay people.
This ratio is calculated by dividing the figure for trade creditors by the annual purchases and then multiplying this answer by 365 days. The figure for trade creditors normally comes from the closing balance sheet and care should be taken that it is typical for the whole year.
 |
These calculations give a profile of the organization to potential suppliers looking for details about how efficiently the business is being run.
Stock Turnover
This ratio looks at how quickly the organization turns over stock into sales, and is therefore another good measure of efficiency. The higher the stock turned the more efficiently the business is being run. It is important that the terms are completely understood and there are no abnormal factors. Normally the definition of stock includes all of the following:
1) Finished goods
2) Work in process
3) Raw materials.
The stock value would usually be taken from the closing balance sheet but you need to consider if it is a typical figure. For example, an organization involved in the retail industry may have a seasonal influence on its operations so you may need to make allowance for this.
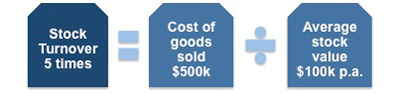 |
The stock turnover ratio is calculated by dividing the cost of goods sold by the stock value.
For example:
If the cost of goods sold is $500,000, and the average stock held during the year is $100,000
• Stock turnover is $500k ÷ $100k = 5
Stock has been 'turned over' five times during the year.
A quick turnover suggests that the organization is efficient in holding the minimum stock used within its operation. Again, this ratio is most informative when looked at over time. If the stock turn is slowing, this may highlight a problem with slow-moving lines that require discounting to sell through.
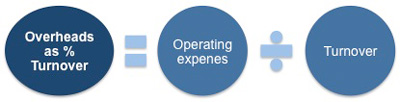
Operating Expenses as a Percentage of Turnover
Examples of operating expenses are:
• Rent
• Utility bills
• Wages, etc.
This is a useful tool in assessing whether or not this area of expense is growing more rapidly than the turnover. This ratio is calculated by dividing operating expenses (overheads) by turnover and then multiplying by a hundred to make the figure into a percentage.
 |
The calculation has little meaning on its own, but when reviewed over several periods it can provide useful information on the trend over that time span.
As an organization grows this percentage should fall. If it doesn't, then the organization needs to review its operating expenses carefully to understand why this is happening and see what management can do to correct it.
You may also be interested in:
Financial Statement Analysis | Key Accounting Ratios | Types of Key Accounting Ratios | Current Ratio Analysis | Calculating Profit | Price/Earnings Ratios | Price-to-Book Ratio | PEG (Price/Earnings to Growth) Ratio | Dividend Yield.
|
|
 |