Financial Statement Analysis - Calculating Profit
You can see if an organization is profitable by looking at the income statement, but you need to put that profit into perspective. This can be done by looking at various accounting ratios that compare profit as a percentage of sales or assets. This Key Financial Ratios Checklist details the key financial ratios you can use to help you interpret financial information. This Financial Ratio Formulas Checklist provides you with a list of the most popular financial ratios used to assess an organization's performance, solvency, profitability and investment potential.
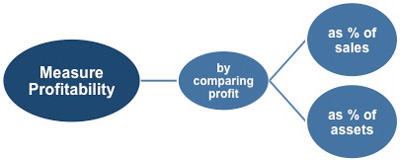 |
There are three ways this can be achieved:
• Gross profit margin
• Net profit margin
• Return on assets
Gross Profit Margin
One of the most commonly used ratios is the gross profit margin, which looks at gross profit as a percentage of turnover (sales). You will find both of these figures in the income statement.
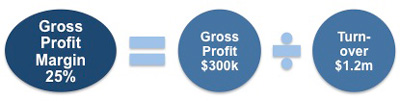 |
The formula used is gross profit divided by turnover, multiplied by a hundred to turn it into a percentage.
For example: An organization's
Gross profit is $300,000
Sales/Revenue were $1,200,000
Its percentage gross profit margin would be ($300,000 ÷ $1,200,000) x 100 = 25%
This means that for every $1 of sales the organization achieves, profit (after taking off the costs of production) is 25 cents.
Many people are often confused by the terms 'gross profit margin' and 'mark-up.' The definition of each term shows how they differ and also shows that you use a different formula to arrive at a figure for each.
Gross profit margin - expresses gross profit as a percentage of total sales.
Mark-up - is the figure or percentage added by management to cover the cost of goods and the required profit margin for a product or service.
From these definitions you can see that the key difference is that management have control over and define what they require as a mark-up, whereas gross profit is dependent on how many sales are made and their value, which management can set targets for, but cannot control directly.
Industries often have what is considered an acceptable range for their mark-up, without which an organization would not be able to operate. You should investigate whether the sector you are interested in has such a range.
The formula for calculating mark-up is:
Mark-up = (total revenue - cost of sales) / cost of sales
This is then multiplied by 100 to give a percentage.
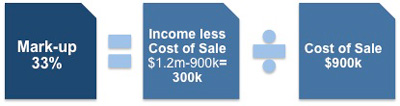 |
For example: An organization's
Sales/Income was $1,200,000
Cost of Sales is $900,000
Its percentage mark-up would be ($1,200,000 - $900,000) ÷ $900,000 = 0.33 x 100 = 33%
This means that to maintain their profitability the organization needs to mark-up by a third.
Net Profit Margin
This ratio is similar to the gross profit margin but looks at net profit as a percentage of turnover. Net profit is shown on the income statement and is defined as follows:
Net profit is the figure left after all operating and non-operating expenses have been deducted from total revenue or income.
To calculate the net profit margin of an organization as a percentage you would divide net profit by total revenue or income and multiply the answer by a hundred to turn it into a percentage.
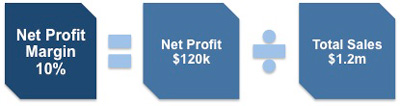 |
For example: An organization's
Sales/Revenue was $1,200,000
Net Profit is $120,000
Its percentage net profit would be = ($120,000 ÷ $1,200,000) x 100 = 10%
You need to be mindful that your net profit is calculated after taking account of all costs and therefore can be affected by a variety of things, such as:
• Declining gross profit
• Increased selling
• Rising administration costs
If your net profit percentage is declining it is worth looking at your costs on an individual basis to see what you can do about those that have increased the most as a proportion of sales.
It is important to look at the trend that emerges over several accounting periods, as opposed to individual figures. The ratios can be used to measure periods other than a full year, as long as you have the relevant income statements.
Return on Assets
You can also measure the level of profit compared to the value of net assets invested in an organization. The assets are the major items that need to be in place for the organization to operate.
 |
These include such items as:
• Fixed assets
• Buildings
• Plant
• Vehicles
• Computers, etc.
• Current assets
• Stock
• Debtors
• Cash
The organization's total net assets are calculated by taking total liabilities from total assets. This represents the amount of capital invested in the organization. Your net assets figure can be taken directly from the balance sheet. You can therefore look at the net profit as a percentage of capital employed.
 |
The return that an organization can expect depends on the industry sector and the economic cycle. However, it remains a good measure of operational efficiency for an organization.
The ratio is calculated by dividing net assets by net profit and then multiplying it by a hundred to turn it into a percentage, as this is the usual way it is expressed.
 |
You would find the net profit figure on the income statement and the net assets would be shown on the corresponding balance sheet.
For example:
An organization's
• Net Profit is $120,000
• Net Assets are $60,000
Its return on assets would be ($60,000 ÷ $120,000) x 100 = 50%
When calculating this ratio you can chose to express it using figures before or after tax.
Capital employed is the net amount invested in your organization by its investors or owners and is taken from the balance sheet. Many people consider this the most important ratio overall and it is useful to compare the results with a return that can be obtained outside of the organization - for example, a low-risk investment in government bonds. The organization's return on assets can be improved either by increasing profitability or decreasing the capital employed.
This Accounting Terminology Checklist outlines the terminology, concepts and conventions that are accepted within the accounting profession. This Profitability Comparison Template enables you to take a high-level view of the profitability of a range of your products or services over a specified period. If you need a basic financial accounting principles pdf then download our free eBook now.
You may also be interested in:
Financial Statement Analysis | Key Accounting Ratios | Types of Key Accounting Ratios | Current Ratio Analysis | Business Performance Ratios | Price/Earnings Ratios | Price-to-Book Ratio | PEG (Price/Earnings to Growth) Ratio | Dividend Yield.
|
|
 |