Activity Network Diagram
Activity network diagrams show project activities and the interdependencies between these activities. They convey critical schedule characteristics required to effectively analyze and adjust schedules.
Network diagrams can be created manually but are also available as project views in project scheduling tools such as Microsoft Project. The major inputs to these diagrams are:
Project Scope Statement
The schedule definition required in network diagram development must be based on the approved scope documented in the Project Scope Statement. If network diagram and schedule definition does not account for all required deliverables in scope, the resulting network diagram and schedule will not accurately reflect the time necessary to complete the work.
Work Breakdown Structure (WBS)
The Project Team must include WBS project work in the network diagram to ensure comprehensive reflection of project activities.
Historical Project Information
The accuracy of network diagram/schedule estimation is strengthened by actual schedule metrics from past projects. Project teams should consider past level of effort and duration for comparable project activities.
WBS Dictionary
This defines task durations, dependencies, predecessor and successor relationships, and resources - all of which need to be defined prior to network diagram creation to ensure that the network diagram accurately reflects the schedule required to successfully complete the project.
Resource Calendars
The Project Team should develop and utilize a resource calendar that includes holidays and personnel availability. Creation of this calendar prior to network diagram creation will ensure that the schedule accounts for actual working time.
Activity network diagrams are made up of a series of activity boxes, each of which depicts a discrete activity or task. Each activity box may contain up to 7 items of information.
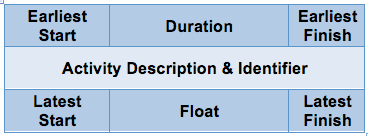 |
The top line of the box reflects the earliest point at which the activity could start and finish. The centerline should contain descriptive information about the activity and the bottom line should be used to reflect the latest start and finish times.
For example,
Activity A must be completed before activity C can begin (indicated by the line that joins the two activity boxes).
Activity A requires 5 days and Activity C requires 4 days (this part of the project will therefore last 9 days).
The earliest start time for activities right at the beginning of the network are set to zero (shown in bold).
The earliest finish time for whichever input activity is the latest is used to establish the earliest start time for the dependent activity.
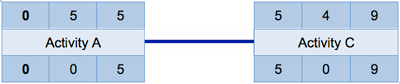 |
In this example, Activity A is scheduled to be completed on day 5. Only then can activity C begin.
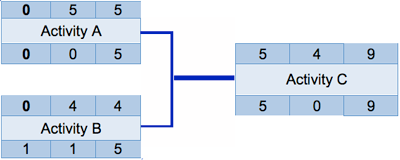
In many cases an activity will be dependent on the completion of more than one preceding activity. In the example shown:
Activities A & B must both be completed before activity C can begin.
A requires 5 days,
B requires 4 days and
C requires 4 days.
Activities A and B can be carried out in parallel as they are not dependent upon each other.
In this example this part of the project will also last 9 days.
 |
Determining the relationships between activities can be a complicated process and may require a substantial amount of discussion involving numerous personnel across the various departments that may be concerned.
The process of identifying relationships between the activities should only be concerned with logical requirements, in other words it should be assumed that there are no resource constraints when drawing the activity network. This issue has then to be addressed and appropriate adjustments made. Resolving resource shortfalls and conflicts is the scope of resource planning and scheduling.
You may well find it useful to produce sub-diagrams and use these to conduct a brainstorming approach to identifying all possible relationships, prior to building the final network. The project will need to be monitored at various points to ensure that its business and technical integrity is being maintained - the activity network should also reflect these activities.
 |
Float is a measure of the amount of time an activity can be delayed without affecting subsequent activities. The amount of float indicates the extent of time that the activity can be delayed without putting back the end date of the overall project (or sub-project). Activities that have an associated float are natural candidates to be delayed when other activities are suffering from problems or overruns.
Reading through the Activity network from left to right gives the total duration of the plan. Reading back through the network, subtracting each duration, shows those activities that have any spare time. This spare time, known as float (shown in red below), is a very useful concept in relation to resource scheduling and smoothing.
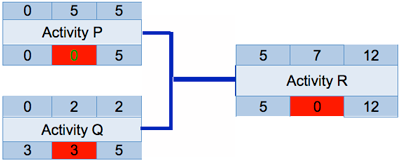 |
In the example shown: Activity R is dependent upon the completion of both of the activities P and Q. However activity P is scheduled to take 5 days whilst Q should be completed in 2 days. The area of work represented by this part of the network should last 12 days.
Activity Q has a float of 3 days so: Q could start up to 3 days late or Q can take an extra 3 days to complete without delaying the start of the subsequent activity R.
Once the resources required to complete each product have been identified and the Activity network updated to reflect these, then the start and finish dates can be added. With the shape and size of the project now visible, the total cost of the resources for each planning period can be calculated.
The Activity network also clearly identifies the critical path, which is the sequence of related activities that will take the longest time. The critical path is an invaluable concept in project planning - as it defines that sequence of activities that should take the longest time.
 |
The critical path is defined as the series of activities that have zero float. There will always be a critical path running through a project from the first activity to the last.
However, any task, if subjected to sufficient delay; may itself become critical. This occurs at the point when its float has been entirely consumed by the passage of time. In larger projects, particularly as the project nears completion a number of the arms of the network may contain zero float i.e. the project may contain numerous critical paths.
The critical path is an important feature in project planning and control and is usually highlighted on the network in some manner - e.g. bold print, red or a different style of line. It is important to remember that the critical path is not defined at the initial planning stage and then set in stone.
As the project progresses and planned activities overrun the network should be frequently updated to ensure that it continues to reflect the true status of the project. The failure to do this is a common reason for projects going out of control and ultimately failing.