Boston Matrix Definition

A key role of management within the strategy planning process is to provide market intelligence. This information and data will play a significant role in analyzing the internal capabilities of the organization, an essential part of strategy development and implementation.
Whatever your management role, you may sometimes be asked for market intelligence that can be used in the strategy planning process. The types of data that are fed into a marketing information system (MIS) cover all areas of the organization - production, operations, sales and marketing, etc.
The more accurate and up-to-date an MIS is, the greater your competitive edge will be. An MIS also helps your organization to identify and respond to the opportunities and threats that have been identified in a SWOT analysis. If you are unfamiliar with the SWOT analysis then download our free SWOT Analysis eBook.
 |
The organization's response can only be effective if it has a clear understanding of its own internal capabilities. One of the most popular tools used by organizations to analyze these is the Boston Matrix.
Bruce Henderson developed this business analysis technique in 1970 for use within the Boston Consulting Group. It was designed for use by its consultants to help corporations with analyzing their business units or product lines.
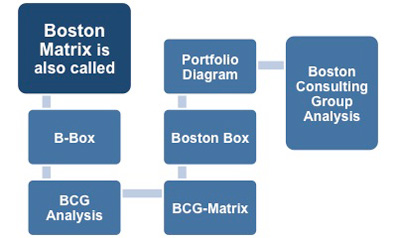
This technique has become known by several different names including: B-Box, BCG Analysis, BCG-matrix, Boston Box, Boston Matrix, Boston Consulting Group Analysis and the Portfolio Diagram. It is important to be aware of these names because you may hear the technique referred to by any one of them.
 |
The Boston Matrix is used to help the organization decide how to allocate resources to each product or service it sells depending on how that product or service is positioned in the market. It is often used by people responsible for brand marketing, product management, strategic management, and portfolio analysis.
Over the last forty years its use has gone in and out of fashion and it has been removed from certain contemporary marketing textbooks. Nonetheless, it can be helpful in considering product positioning as long as its findings are not used in isolation and its limitations are acknowledged.
The Boston Matrix helps to facilitate discussions on the value of the contribution made by, and investment required for, specific products and services. Its findings enable decisions to be made as to which ones should be maintained, which should be withdrawn, and which should be developed further.
The matrix consists of two axes: one showing market growth and the other showing market share. The resulting four quadrants form the categories by which an organization can classify its business units or products. The analysts then plot a scatter graph within the matrix that ranks either business units or products and services on the basis of their relative market shares and growth rates.
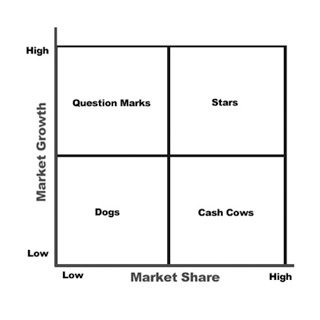 |
This provides an initial and high-level way to screen your organization's opportunities. It provides a mechanism that enables you to think about how best to allocate resources and investment funding in order to maximize future profit and growth for your portfolio of products and services.
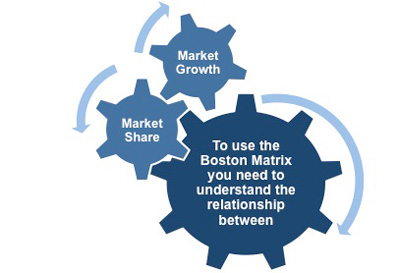
This matrix considers the two strategic parameters of market share and market growth when it allocates a priority to a product in terms of organizational focus and activity. In order to appreciate how this prioritization is assessed you need to understand how market share and market growth are interrelated.
 |
Market Share
Market share is the percentage of either revenue or volume of sales that your organization has of the total market. In other words, the higher your market share, the bigger the proportion of the market you control and influence. The matrix also assumes that earnings rise as your market share does. This is not always the case and is one of the limitations of this analysis.
The Boston Matrix also makes a big assumption in its interpretation of market share and how it relates to profitability. It assumes that a high market share means that this organization is highly profitable for this product or service. It attributes this to the organization being well established and knowledgeable about the market, and having attained the advantages of the economies of scale.
This may have been a safe assumption nearly fifty years ago, but it is not necessarily the case today. There are many reasons why a product may be a market leader but not necessarily the most profitable. For example, it may be fulfilling the role of a loss leader in terms of the initial purchase, but then profits are made through the associated products. For example,
The leading manufacturer of desktop printers may have the largest market share but they may be prepared to make a loss on each printer sold because they make their profit from the sale of the proprietary printer cartridges that are sold subsequently.
The usual way that market share is expressed is as a ratio relative to your largest competitor, because this illustrates the extent to which you dominate the market. So if you have a 20% market share, and your nearest competitor has a 10% share the ratio is 2:1.
Whether a relative share is high or low depends on the industry. For example, in the Fast Moving Consumer Goods (FMCG) market the brand leader is often very stable and profitable. In fact, market share in FMCG tends to follow the '123 rule.' This means that the brand leader's share is double that of the nearest competitor and triple that of the next nearest.
Market Growth
Market growth is the percentage growth compared to the previous year. It is used as a measure of how attractive a market is to existing providers and potential new entrants.
High market growth creates an environment in which it is relatively easy for organizations to grow their profits, even if their market share remains the same.
In contrast, if your product is in a low growth market you will face intense competitive activity and your organization will need to employ significant effort just to retain its market share, even if it is an established provider. Often such market retention is only achieved by aggressive discounting, which makes such a low-growth market less profitable and unattractive.
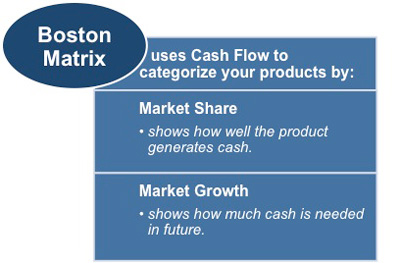 |
The Boston Matrix uses cash flow as its means of categorizing an organization's product or service portfolio. It uses market share to illustrate how well a product or service can generate cash and it uses market growth to indicate how much future cash is required.
|
|
 |
You may also be interested in: Boston Matrix Definition, Classifying Products and Business Units, Stars, Question Marks, Cash Cows, Dogs, Using the Boston Matrix at Brand Level, A Balanced Portfolio and Advantages and Disadvantages.