Project Quality Control
Quality control attempts to answer two questions: Firstly, is the project meeting its quality requirements and if not, how can this be addressed?
The project management team should have a working knowledge of statistical quality control, especially sampling and probability, to help evaluate quality control outputs.
 |
Before looking at the process in detail, make sure you are familiar with the following terms:
• Prevention - keeping errors out of the process
• Inspection - keeping errors out of the hands of the customer
• Attribute sampling - the result either conforms or does not conform
• Variables sampling - the result is rated on a continuous scale that measures the degree of conformity
• Tolerances - specified range of acceptable results
• Control limits - thresholds, which indicate whether the process is out of control
• Grade - is a category assigned to products or services having the same functional use but different technical characteristics. While a quality level that fails to meet quality requirements is always a problem, low grade may not be.
For example, a software product can be of high quality (no obvious defects, readable manual) and low grade (a limited number of features).
The project manager and the project management team are responsible for managing the tradeoffs involved to deliver the required levels of both quality and grade.
• Precision - means the values of repeated measurements are clustered and have little scatter.
• Accuracy - the measured value is very close to the true value.
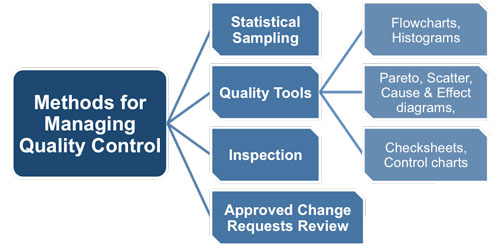
The overall project plan contains the quality plan, which describes how quality control will be performed within the project. There are seven basic quality tools that can be used as well as statistical sampling, inspection, and reviewing approved change requests.
 |
1. Cause and Effect Diagrams
These type of diagrams show how different factors may be linked to potential effects or problems. They can be referred to as fishbone or Ishikawa diagrams. This type of diagram can be used on all project types because it is not based on any statistical technique. It is therefore limited if your project needs quantitative assessment because it relies on subjective judgment and analysis.
It is useful in situations that have numerous interacting variables that can make sense out of this complexity of interactions, none of which are quantifiable. A benefit of this tool is that it is extremely useful when needing to communicate the results of your analysis to other members of the project.
2. Flowcharts
The benefit of flowcharts when explaining your analysis to others is that it is easy to identify the decision points, activities, and the order of processing. It will be show in a graphical form that easily illustrates the relationships among process steps.
3. Check sheets
These are exceptionally useful to a project manager when gathering data as they provide a checklist to follow. They can often be referred to as tally sheets.
4. Histogram
This is bar chart that shows its data in a vertical format rather than a horizontal format. The height of each bar depicts the relative frequency of a specific variable in a situation that occurred. This type of tool is especially helpful when needing to indicate to stakeholders which of the project problems need to be tackled first and why.
5. Pareto Diagram
Another specialist form of a histogram is the Pareto diagram which has an additional line graph to demonstrate the cumulative totals of each category. This type of histogram shows the plotted values in a descending order.
6. Control Charts
By using a control chart it is easy to show the pattern of data points in such a way that it shows where there are sudden jumps in the process, random fluctuating values occurred or that there is trend of gradual variations. This tool is useful in long-term monitoring as it reveals if and when, the application of process changes resulted in the required improvements.
7. Scatter Diagram
Display the data as a collection of points using Cartesian coordinates to display values for two variables for a set of data. Each point has a horizontal axis value of one variable and another variable to determine its position on the vertical axis.
8. Statistical Sampling
Statistical Sampling involves choosing part of a population of interest for inspection. Sample frequency and sizes should be determined so the cost of quality will include the number of tests, expected scrap, etc. In some application areas it may be necessary for the project management team to be familiar with a variety of sampling techniques in order to chose the most appropriate one.
9. Product Inspection
Product Inspection is the examination of a product to determine whether it conforms to documented standards. The results of an inspection generally include measurements and may be conducted at any level. For example, the results of a single activity can be inspected, or the final product of the project can be inspected. Inspections may be called reviews, peer reviews, audits, or walkthroughs.
All approved change requests should be reviewed to verify that they were implemented as approved.
You may also be interested in:
Managing Project Quality | Quality Management Techniques | Project Quality Management and ISO Quality Management | Quality Assurance | Quality Control | Testing Project Deliverables | Quality Audits | Post-Implementation Audits.
|
|