Income Statement Ratios
Internal income statements used by managers are typically more useful than those generated for investors and third parties, because they contain greater detail than the highly summarized published versions.
The best way to use an income statement is to compare a recent one with earlier ones for a similar period. You can also compare them to the expectations set out by the organization in their long-term plan. This is often discussed in the Chair's or CEO's section of an annual report.
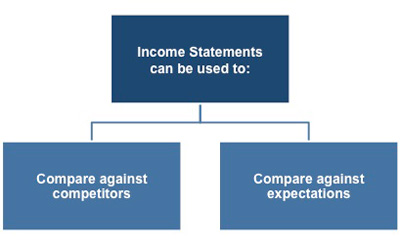 |
They are also very useful for comparing your organization's financial performance with that of its main competitors. It is by comparison against some benchmark that the income statement has its greatest value, something that can not be done when you look at a single income statement in isolation.
This Key Financial Ratios Checklist details the key financial ratios you can use to help you interpret financial information. This Financial Ratio Formulas Checklist provides you with a list of the most popular financial ratios used to assess an organization's performance, solvency, profitability and investment potential.
Income Statements in Comparative Formats
You may have seen income statements presented in several comparative formats when they are used internally. These formats present two or more years of data side-by-side to make it easy to compare the figures.
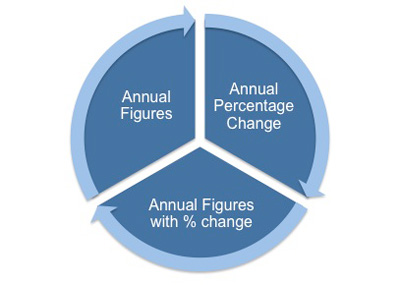 |
The most common formats for comparison are:
• Annual figures
• Annual figures with percentage change
• Annual percentage
When you are making such comparisons within your organization you will normally use actual dollar amounts. This format makes it easy to see any increases or decreases in sales, expenses, profits, and any of the detailed amounts when making decisions.
Comparison of Annual Figures
The following table shows the dollar amounts for Gary's Garden Furniture for this year and the previous one. All amounts are in US dollars.
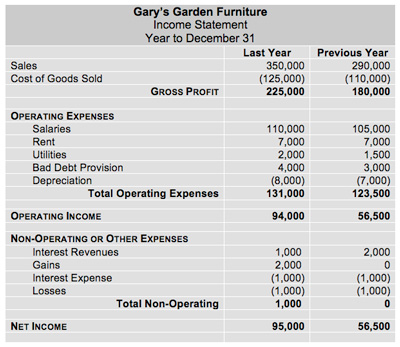 |
This comparison shows you that Gary's has managed to increase sales from $290,000 to $350,000 dollars and the company made an additional $39,000 in profit.
Comparison of Annual Figures with Percentage Change
You can find comparing your organization's figures in this way really useful as the addition of percentage changes makes it easier to make comparisons and to draw meaningful conclusions.
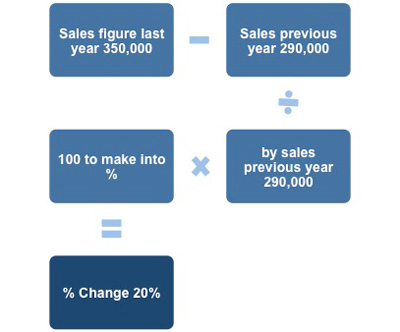
To work out the percentage change between years is a simple calculation. First you take the previous year's sales figure from last year's sales figure. Then you divide this answer by the previous year's sales and then multiple by 100 to turn it into a percentage.
 |
The resulting percentage change figures are then added to the income statement. Using the comparison method, the following table shows that all of the changes in operating costs between last year and the previous year have been shown as percentages.
 |
The questions you might ask when analyzing this income statement are:
Sales have increased by 21% - how did this impact operating expenses? Have they increased by more or less than 21%?
Operating expenses have increased by only 6%. You would hope to see some of the value of the increased sales reflected by an increase in operating income. Operating income increased by a massive 67%.
In this example, the figures have vindicated the decision by Gary's management to stock more exclusive ranges of garden furniture as the increased value of sales has had little appreciable effect on operating costs.
This example illustrates that using income statements in this way is an extremely useful management decision-making tool.
Annual Percentage Comparison
It is also possible to convert all of the figures on the income statement to percentages of net sales as shown in the example below.
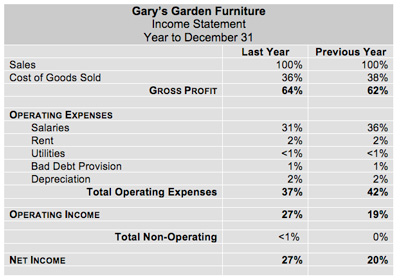 |
Using this format you can see that the percentage of gross profit is only up by 2%.
Gary's are not making an appreciably higher percentage margin on the furniture they sell, but their operating expenses (as a percentage of sales) have fallen by 5%.
This means that more of the sales revenue is finding its way to the bottom line. In fact the organization has increased its percentage net income from 20% to 27%.
This Accounting Terminology Checklist outlines the terminology, concepts and conventions that are accepted within the accounting profession.
You may also be interested in:
Income Statement Definition | Income Statement Format | Multiple-Step Income Statement | Income Statement Explained | Operating Expenses Definition | Common-Size Income Statements | Common-Size Analysis | Income Statement Cash Flow.
|
|
 |