Common-Size Analysis of Balance Sheet
In the same way that breaking an income statement down into percentages (by dividing each item by revenues) is informative, it is equally revealing for a balance sheet. Performing a common-size analysis on a balance sheet can be done in one of two ways:
• Vertical common-size analysis
• Horizontal common-size analysis
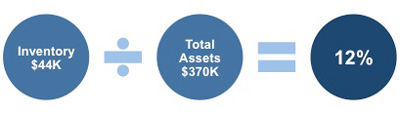
When using a vertical common-size analysis, you express inventory, liabilities, and equity as a percentage of total assets. In the case of Fred's Factory its inventory of $44,000 is nearly 12% of its total assets of $370,000.
 |
To fully appreciate the ability of an organization's management, such figures need to be compared to those of the two or three previous years to gain some insight from changes that occur over this period.
For example,
If you know that Fred's inventory this last year was 12% of total assets but that this figure was only 10% in previous years, then you would be able to say that their inventory is growing faster than their total assets.
You could then look into this particular area to discover why this is the case.
You may prefer to perform a horizontal common-size analysis as this compares the change year on year for each item of both the income statement and the balance sheet. This enables you to look at how an item has changed relative to the change in total assets and revenue.
The table below gives you some additional figures so that you can see how Fred's inventory has changed when using this method.
 |
From this, you can see that revenue has grown by 33%, while assets have only grown by 6%, although inventory increased by 22%. You would need to carry out further investigations to be able to discern the reasons why both revenue and inventory have grown so much whilst assets are relatively stable.
You would also want to determine what the long-term impact of this pattern could be if it continued. It may indicate that Fred's need to watch their earnings quality or that they may be in danger of overstating inventory or building it up too much. Whatever the reason, the balance sheet has highlighted this as a potential area of inefficiency that will need to be addressed.
Another key area to watch closely is receivables. If your calculations show that they are increasing faster than revenue, this may indicate that Fred's Factory has a problem with collections. You would want to understand the management's attitude to increasing its allowance for doubtful accounts, because if receivables are increasing faster than revenue Fred's may need to change to a faster pace in this area.
Other Key Ratios
Earnings quality is only one of many ratios you can use to assess the ability of an organization's management. You can also judge how well an organization is managing its inventory and receivables.
A few important ratios you may wish to use as part of your assessment of an organization are:
• Inventory turnover = cost of goods sold ÷ average inventories
• Receivables turnover = sales ÷ average accounts receivable
• Total asset turnover = sales ÷ average total assets
If this is an area you wish to explore in more depth then you should download our eBook 'Assessing Financial Performance'. This free eBook goes into this area in greater detail using worked examples to ensure clarity.
This Key Financial Ratios Checklist details the key financial ratios you can use to help you interpret financial information. This Financial Ratio Formulas Checklist provides you with a list of the most popular financial ratios used to assess an organization's performance, solvency, profitability and investment potential. If you need a basic financial accounting principles pdf then download our free eBook now.
You may also be interested in:
Reading a Balance Sheet | Assets, Liabilities, and Equity | Assets Definition | Liabilities Definition | Equity Definition | Balance Sheet Explained.
|
|
 |